The Price of Winning
I got tired of losing to people's wallets, so I measured it. 655,000 real matches across three games, and the part where the data told me I was asking the wrong question.
I play a lot of games. PC, PS5, mobile, mostly online multiplayer, and mostly the kind where you are up against another human being. Honestly, I play so much that sometimes my fingertips go completely numb and it takes a while for the feeling to come back. But I digress.
I will put up with a lot in a game. Bad balance, weird patches, a matchmaking queue that takes six minutes. There is exactly one thing that makes me uninstall: when I can feel that the person beating me did not outplay me. They outspent me.
That is pay-to-win. You are not losing on skill, you are losing because you did not buy the card, the upgrade, the player. It is like putting a Formula 1 driver in a stock Fiat 500 and lining them up against an average guy in a Porsche Taycan. The F1 driver knows exactly what to do. It does not matter. The other car just goes faster.
The thing is, "this game is pay-to-win" is an accusation people throw around constantly and almost never support. It is a vibe. And vibes are a terrible basis for arguing with a game studio, or for deciding whether a business model is actually damaging the product.
So I stopped arguing and pulled the data. 655,000 real matches across three games, from the games' own public APIs.
Here is what I found, including the part where the data told me I was asking the wrong question.
The one number that lets you compare three different games
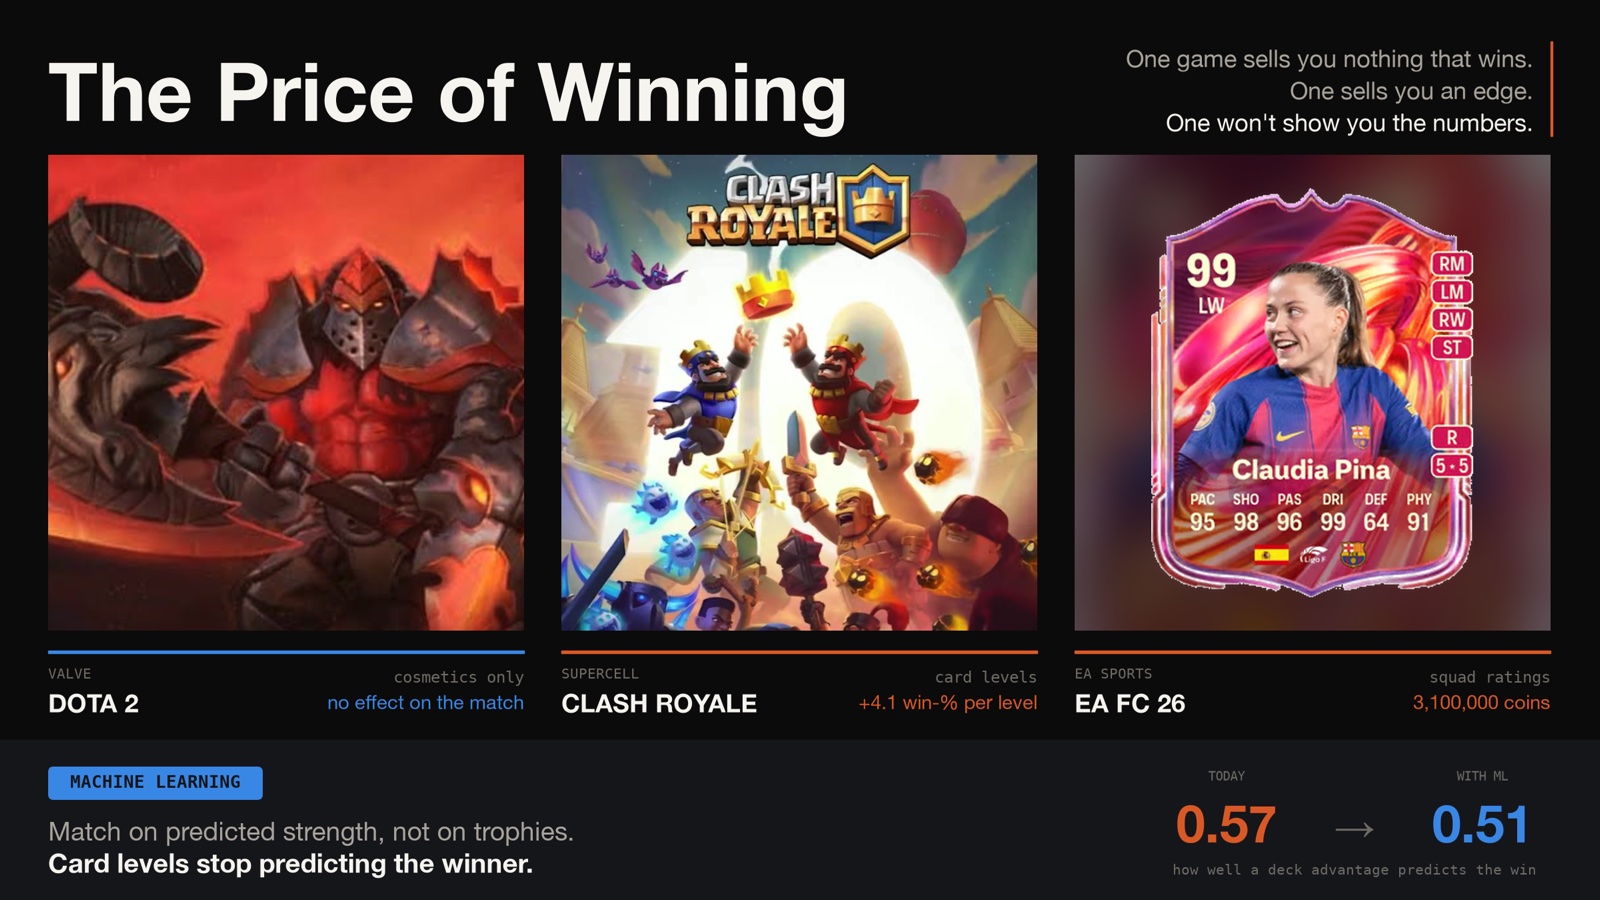
The three games I care about sell you completely different things. Clash Royale sells card levels. Dota 2 sells hats. EA FC 26 sells footballers. You cannot compare "a level 14 Hog Rider" to "a 99-rated Claudia Pina" directly.
So you need a measure that does not care what is being sold. Here is the one I used, and it is simpler than it sounds:
First ask how well you can predict the winner knowing only how good the players are. Then ask how much better you can predict it once you also know what they have bought.
That gap is the whole thing. If knowing someone's spending tells you nothing extra, the game is fair. If it tells you a lot, the wallet is playing the match.
I will call it the pay-to-win index. Zero means money adds nothing. The higher it climbs, the more the outcome is being decided at the shop instead of on the board.
Notice what this does not measure: whether people who spend money win more. That question is useless, and Dota 2 is about to show you why.
Dota 2: the game that caught my own method cheating
Dota was supposed to be the boring one. It is the control group. You cannot buy power in Dota, everything in the store is cosmetic. A fancy hat does not add damage. The correct answer is known in advance: zero.
I pulled 41,504 ranked matches from OpenDota, and because the API exposes how many cosmetic items each player has equipped, I could actually measure "spending" instead of guessing at it.
Then I plotted win rate against cosmetic advantage, and got a chart that looks like a smoking gun.
Players with more cosmetics win 43.8% of the time when they are behind on items, and 58.5% when they are ahead. A clean, monotone slope. If I showed you that chart without telling you what game it was, you would say the game was rigged.
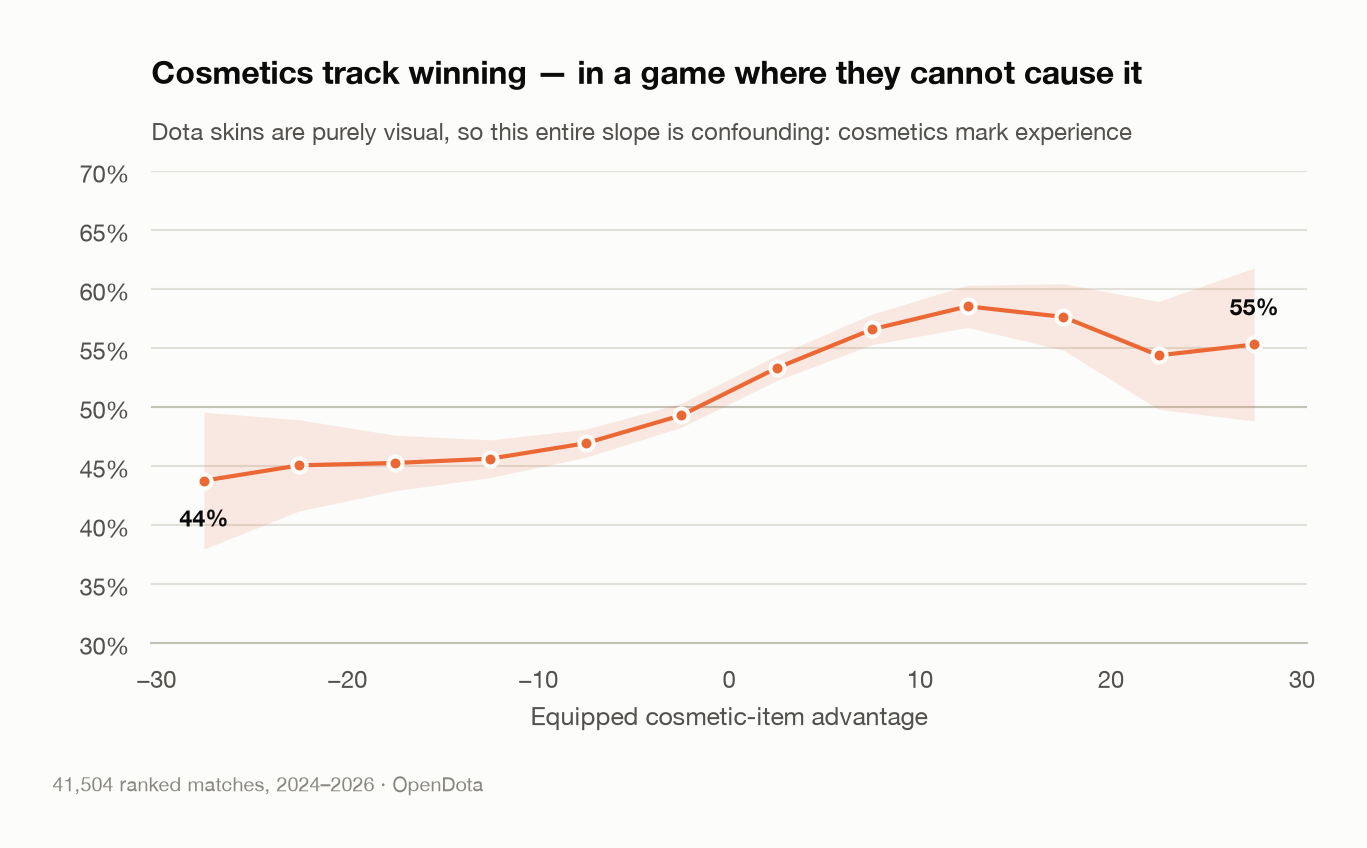
It is not. It cannot be. Hats do not do damage.
What is actually happening is obvious once you say it out loud: people who own a lot of cosmetics have been playing for years. Hours make you good. The cosmetics are not causing the wins, they are just marking the people who have played a lot.
This is the single most useful thing I learned from the whole project, and it has nothing to do with games. "People who spend more win more" is not evidence of pay-to-win. It is the sort of correlation that will survive any amount of indignant tweeting and still mean nothing.
But here is the part I did not expect.
I ran Dota through the full method, control for skill, then ask what spending adds. And the index did not come out at zero. It came out at 0.10.
In a game where the true answer is definitionally zero.
I also ran a column of pure random numbers through the identical pipeline as a sanity check. That scored 0.005, basically nothing, which is what a meaningless variable should score.
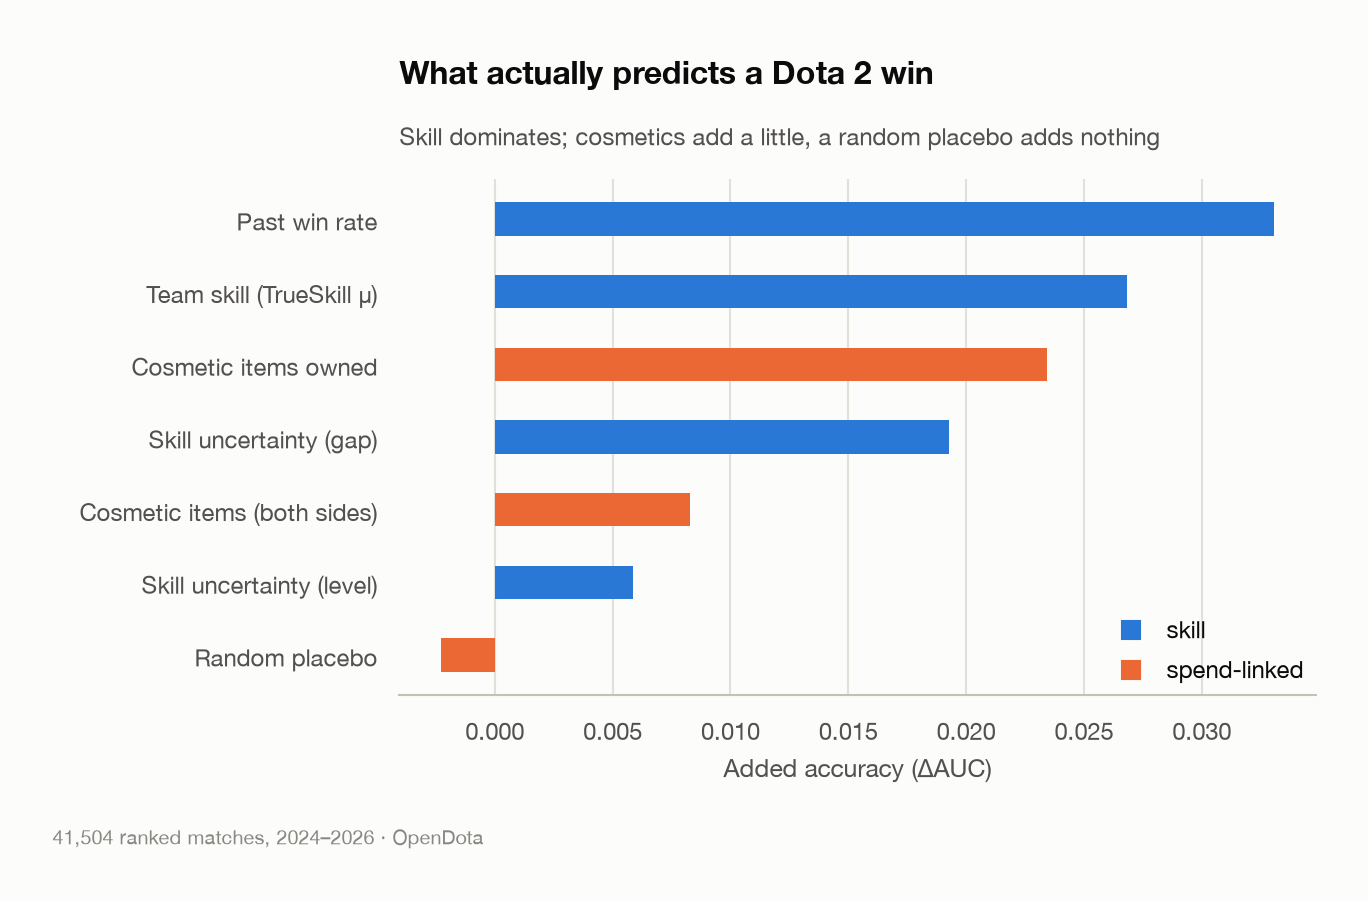
So the 0.10 is not noise. It is my measuring instrument reading high, because anything you can buy carries a faint fingerprint of how invested a player is, and investment correlates with skill. No amount of controlling gets that out completely.
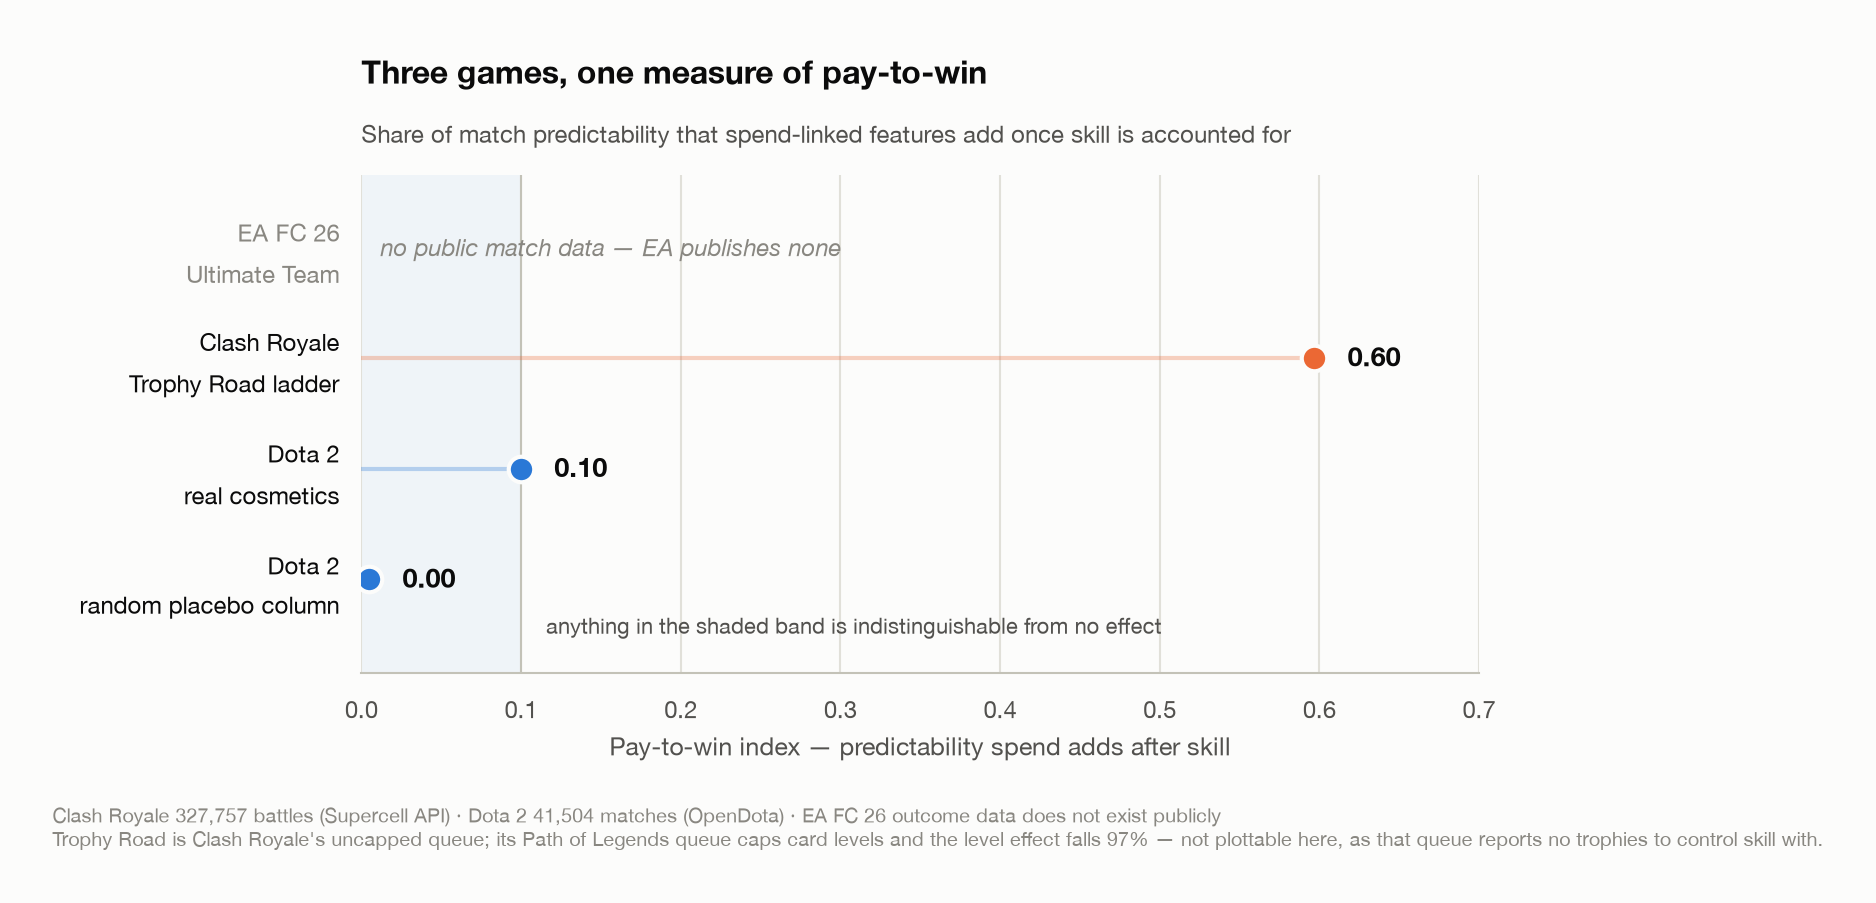
That gives me something I did not have before: a floor. Dota tells me what "zero pay-to-win" actually looks like on my own scale. Anything at or below 0.10 is indistinguishable from a game that sells nothing but cosmetics.
Which means every other number in this article has to be read against 0.10, not against zero. If I had skipped the control group, I would have been over-reading my results by that much and never known.
Clash Royale: where the wallet gets into the match
Now the interesting one.
Clash Royale is a card game. You bring eight cards, your opponent brings eight, you knock down each other's towers. Cards have levels. A level 14 card genuinely does more damage and has more health than the same card at level 11. This is not a perception thing, it is in the stats. And levels are bought with gold, gold comes from gems, and gems come from your bank account.
I crawled 613,616 battles from Supercell's official API, covering July and August 2026.
The first thing to understand is that matchmaking already pairs you by trophies. Across the whole dataset the average trophy gap between opponents is about 45 out of 13,000. So when you sit down, the game has already decided you two are evenly matched.
Which makes the next chart pretty damning.
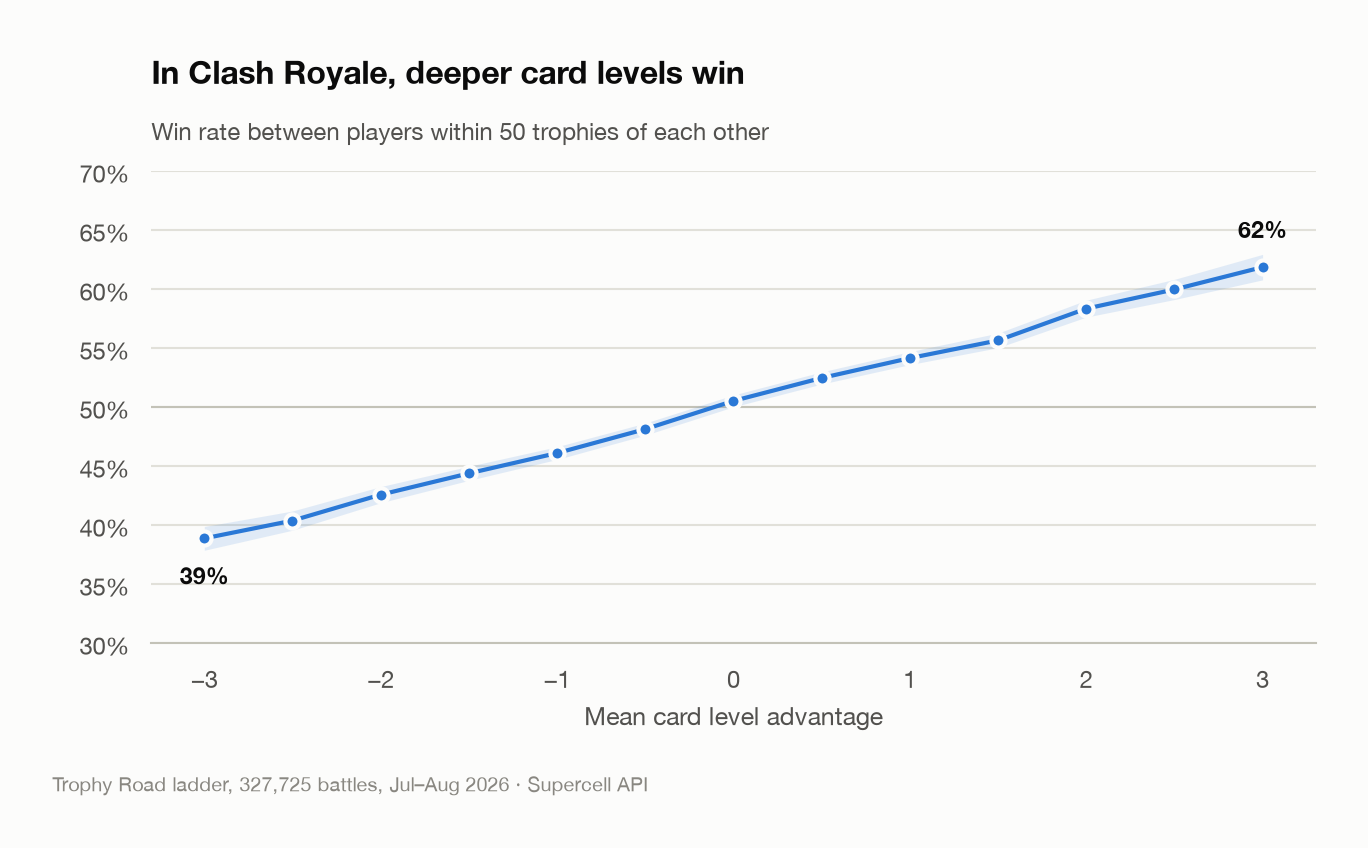
Holding trophies fixed, same bracket, same ladder position, the game thinks it is a fair fight, here is how win rate moves with card levels:
| Card level advantage | Win rate |
|---|---|
| -3 levels | 38.9% |
| Equal levels | 50.5% |
| +3 levels | 61.9% |
Same trophies. Three card levels. That is a 23-point swing.
The pay-to-win index for Clash Royale comes out at 0.597. Against Dota's floor of 0.10, that is not close.
Here is a real battle from the data, which I like because it makes the point better than the aggregate does:
Player A   13,590 trophies   card levels 11,14,11,11,14,11,11,8   -> mean 11.4
Player B   13,595 trophies   card levels 14,14,14,15,16,14,14,8   -> mean 13.6
Five trophies apart. Two full card levels apart. And in this particular match, A won.
That is why you need 300,000 battles instead of an argument. Card levels do not decide matches, they tilt them. Across the whole dataset, the player with better cards wins 54% of the time. Narrow it to matches where someone has a 2+ level advantage and it goes to 61%.
You will never notice that in a single session. You will notice it over a season, and by then you will have blamed yourself.
"But maybe they just played more"
This is the objection I would raise if someone showed me the chart above, and it is a good one. Card levels do not only come from money. They come from time. Free players get there too, just slower. So maybe the whole effect is just "people who have played longer have better cards and are also better at the game", the Dota confound again, wearing a different hat.
To answer it I needed to know how long each player had actually played, which is not in the battle log. So I went and crawled 43,199 player profiles to get everyone's lifetime battle count, then matched those back to 39,667 battles where I had profiles for both sides.
Two things fell out.
The first is that being an old account buys you nothing. Account age correlates with card levels at -0.06, essentially zero. Only playing builds levels, not existing. That kills the "they are just veterans" explanation cleanly.
The second surprised me. Battle count is a strong predictor of losing. At the same trophy level, the player who needed more games to get there loses more often, and the effect is bigger than the card-level effect. Which makes sense when you think about it. If two people are sitting at 13,000 trophies and one took 50,000 games to get there and the other took 5,000, you already know which one is better. Grinding to a bracket and belonging in it are different things.
And now the actual answer: holding play time constant, 68% of the card-level advantage survives.
So about a third of what looked like a pay-to-win effect really was just "this person has played more." Two thirds of it was not. Between two players at the same trophies who have played the same number of games, one extra card level is still worth +3 percentage points of win rate.
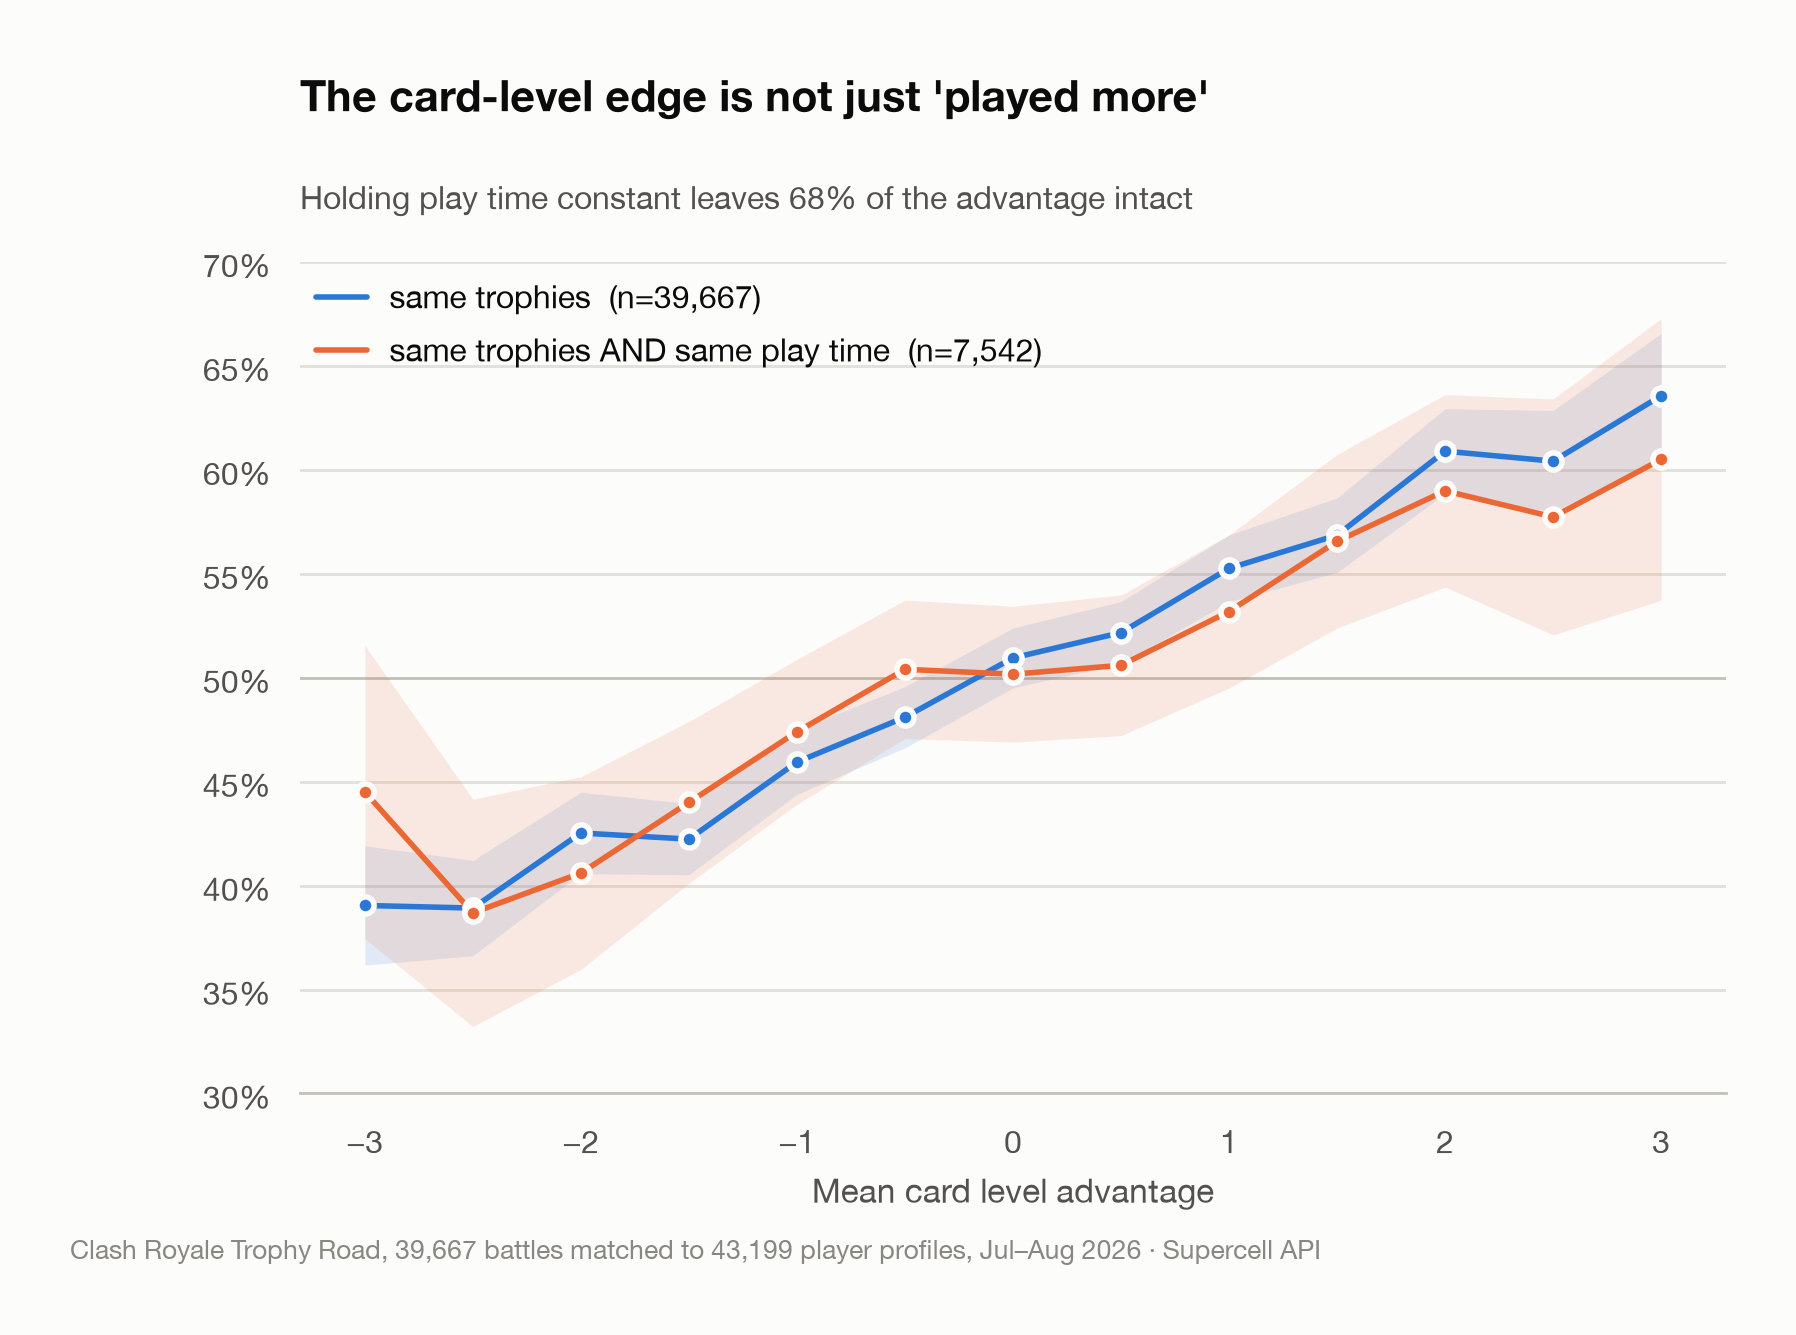
That is as close as public data can get to isolating money. I want to be straight about the limit: what survives is not purely money either, it also contains how efficiently someone plays, whether they do clan wars, and plain chest luck. It is an upper bound, not a measurement. But it is a real one, and it is a lot better than a vibe.
The part I genuinely did not see coming
While I was pulling battles, I noticed the API tags each one with the queue it came from. Clash Royale runs two ranked ladders at the same time. Trophy Road uses your real card levels. Path of Legends caps them.
Same players. Same collections. Same weeks. One queue where the wallet walks into the match with you, and one where it stops at the door.
That is not a simulation of a fix. That is a fix, already shipped, running in production, with a control group attached. I could not have designed a better experiment if the studio had let me.
So I fit the card-level effect separately in each:
| Queue | Battles | Effect per card level |
|---|---|---|
| Trophy Road, real levels | 327,772 | +4.08 pp |
| Path of Legends, levels capped | 285,844 | +0.13 pp |
The advantage drops by 96.9%.
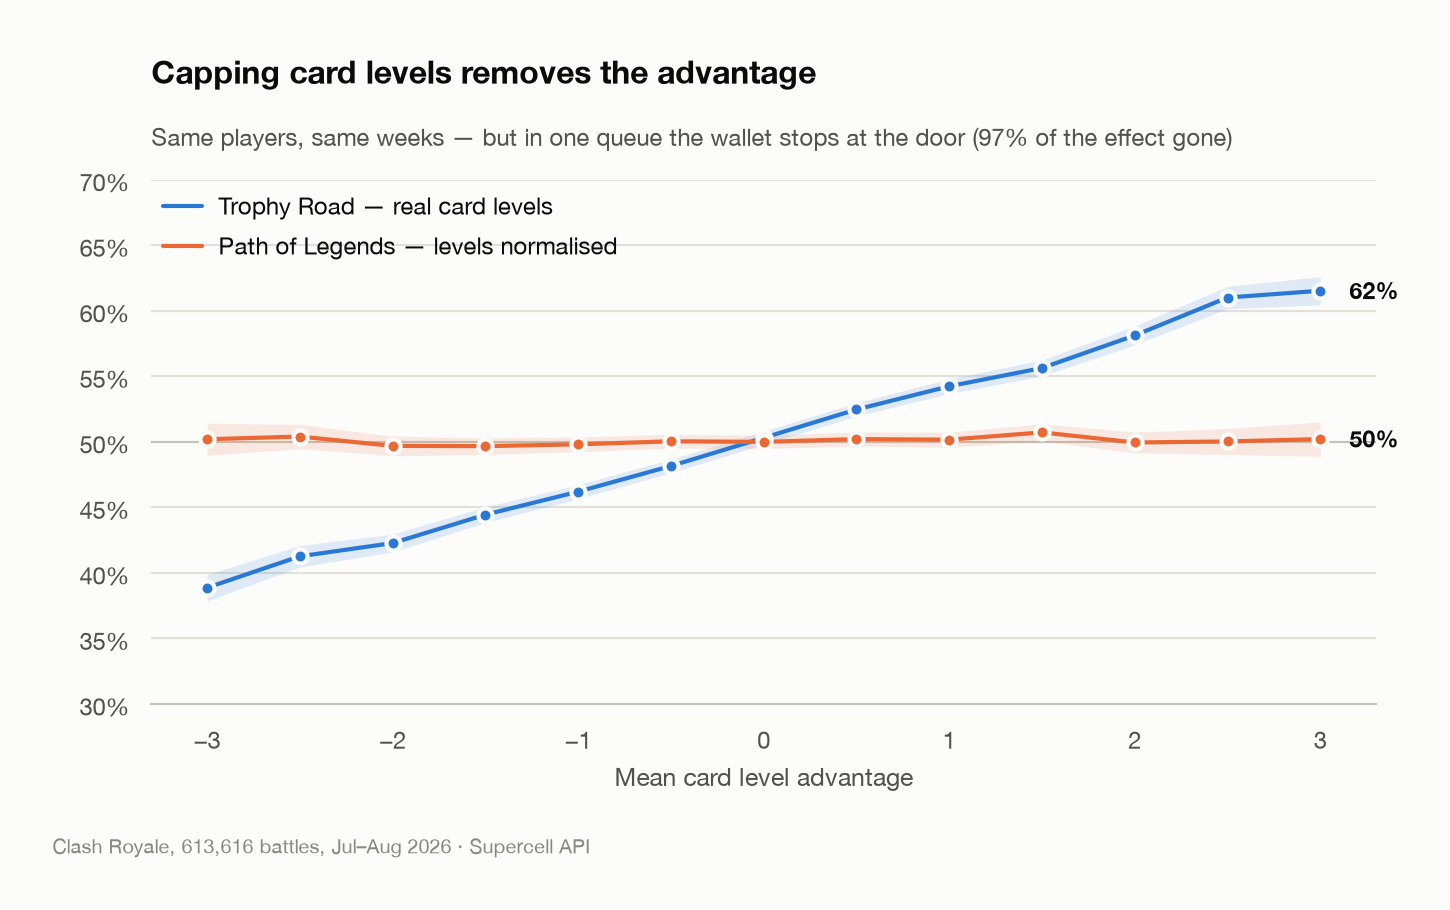
Sit with that for a second. The pay-to-win effect in Clash Royale is not a fact about the game. It is a setting. Supercell has already built the version where money does not reach the match, and they run it right next to the version where it does.
I will be precise, because this is the most quotable number here and I do not want it over-quoted: it is a 97% reduction, not elimination. With 285,000 battles, the residual effect is small but its confidence interval just barely excludes zero. A leftover edge is plausible on the merits, since a level cap does not obviously neutralise everything. But the difference between the two queues is enormous and it is not ambiguous.
EA FC 26: the one that will not show you its homework
And now the game that made me angriest, for a reason I did not expect going in.
FC 26 is where pay-to-win stops being subtle. In Ultimate Team you build a squad, and to climb the divisions you need top-rated players. Line up a basic squad against a team of 98s and 99s and it does not matter how well you defend. The game closes the door.
I can prove exactly one half of that, and it is not the half you would want.
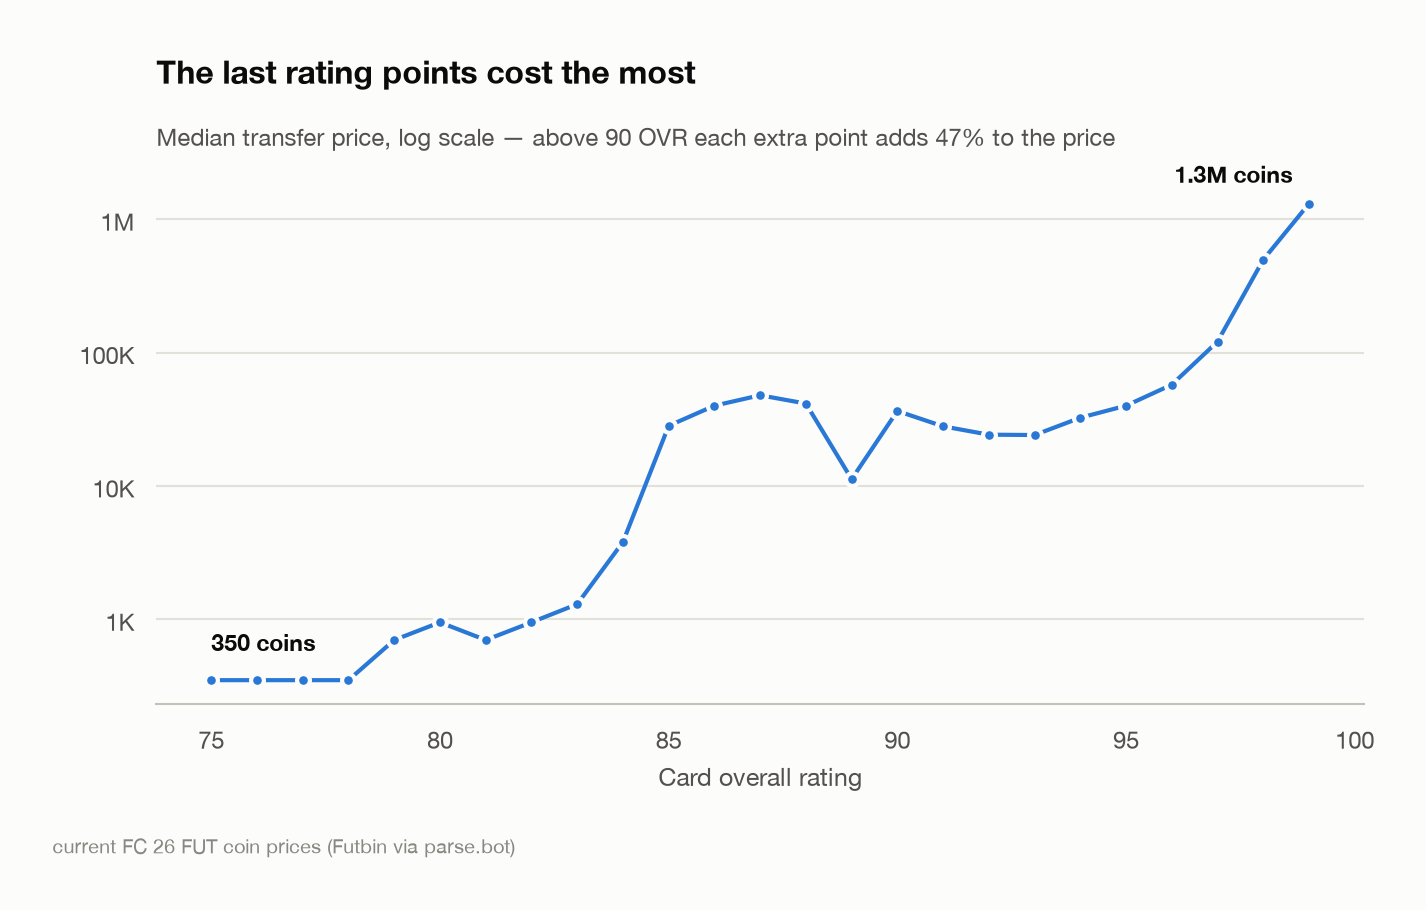
The input side I can measure precisely. I pulled 2,226 current FC 26 cards with live transfer-market prices. Above 90 rating, the price of a card grows about 47% per rating point. The last few points of quality cost more than the entire rest of the squad.
But the single best number in this whole article is this one.
Claudia Pina plays for Barcelona. In FC 26 she exists as eight different cards, and I got the price of every one:
| Her card | Rating | Price |
|---|---|---|
| Normal | 86 | 2,200 coins |
| FUT Birthday | 92 | 12,500 |
| TOTY | 95 | 76,500 |
| UWCL RTTF | 96 | 448,000 |
| Futties | 99 | 3,100,000 coins |
Same footballer. Same real-world ability. The only thing that changes is the number printed on the card. Thirteen rating points, and the price multiplies by 1,409x.
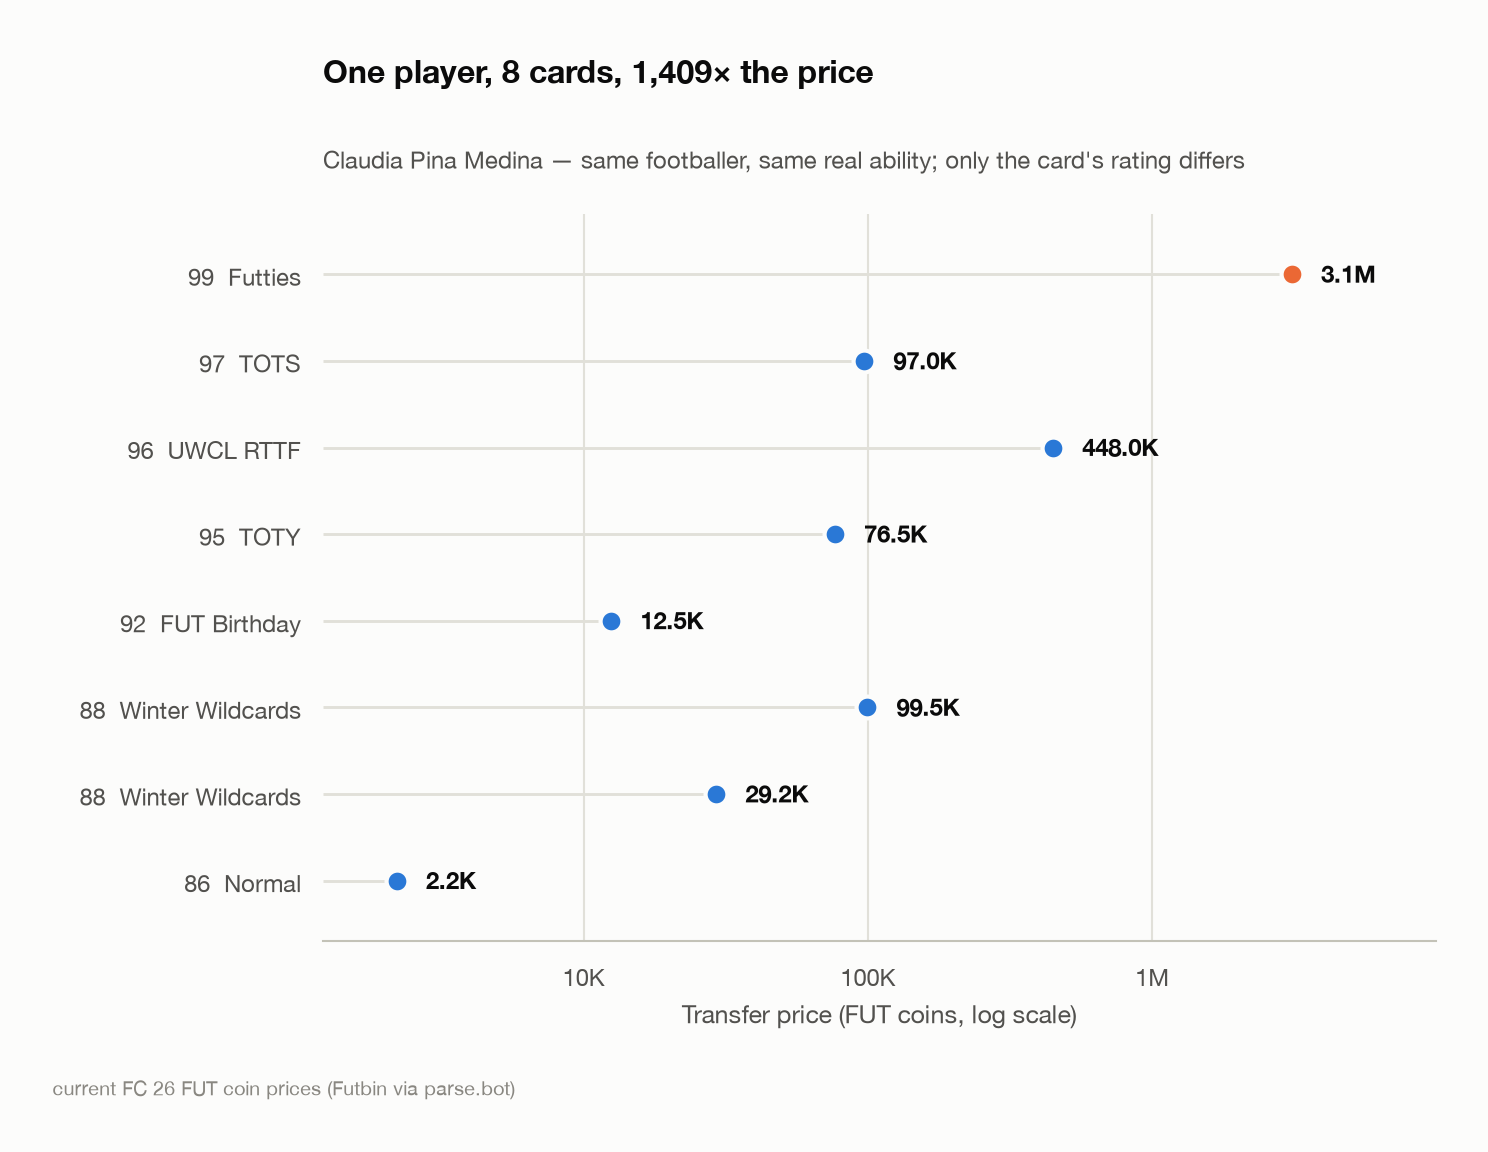
I like this because it removes the obvious objection. Normally better players cost more because they are better, you cannot separate the rating from the person. Following one player across her own cards separates them completely.
And coins are not an abstraction. On the black market they go for roughly €2 per 100,000, which turns every price in that table into real money. Her Futties card, at 3.1 million coins, is about €62. For one player. For one season.
Now scale it to a team. A full Ultimate Team squad is eleven starters and seven substitutes, eighteen cards in total.
| What you are buying | Coins | Real money |
|---|---|---|
| Her Futties card, on its own | 3,100,000 | €62 |
| A full squad at the median 99 price | 23,580,000 | €472 |
| A full squad of cards like hers | 55,800,000 | €1,116 |
That bottom row is eighteen Pina-grade cards. It costs more than the console you play it on.
Or you grind it. At a generous 1,000 coins per match, 23.58 million coins is 23,580 matches, about eight years at two hours a day. Turn that around and it becomes the most uncomfortable number I calculated: choosing to grind rather than pay values your time at about eight cents an hour.
In Clash Royale, money buys time. It compresses a grind that you could, in principle, complete. In FC 26 the grind outlives the game. The season is one year. Time is not a substitute for money here, it is not even in the same conversation.
And here is the part that actually bothers me as someone who works with data: I cannot measure whether any of it wins matches.
EA publishes no match logs. No community tracker exposes them. There is no dataset on Kaggle, no API endpoint, nothing. I checked all of it. So for the game with the most blatant monetisation of the three, the outcome side is simply unavailable to anyone outside the company.
That is why FC 26 has an empty row on my comparison chart. I could have put a plausible-looking bar there and nobody would have questioned it. That would have been the easiest paragraph in this article to write and the least defensible.
The most spend-driven game of the three is also the only one nobody can audit. I do not think that is a coincidence, and I think it is the finding.
So can machine learning fix matchmaking?
Yes. And the way it works is not the way most people assume.
Today the matchmaker pairs you by trophies, a single number that knows nothing about your cards. So it puts two players together, calls it fair, and hands one of them a 6-point head start.
The ML version does three unglamorous things.
1. It learns what actually decides a match
Fit a model on real battles and let it tell you which features predict winning. Mine came out as:
strength = (0.119 * deck_level) - (0.350 * log(games_played))Deck level helps. Games played hurts, for the reason above. That second term matters enormously, because it is a skill signal money cannot buy.
2. It learns the exchange rate
Not just that levels matter, but how much, in win probability. Two deck levels is worth about six points.
3. Then it pairs people so those things cancel
Instead of "find someone with similar trophies," it is "find someone with similar predicted strength."
Here is what that does, using the real fitted numbers:
Today: A has deck level 13 and 5,000 games. B has deck level 11 and 5,000 games. Same trophies, same hours. A wins 55.9% of the time.
Balanced: A gets matched with C instead, deck level 11, but only 2,537 games. C reached the same bracket in half the matches, so C is genuinely the better player. A wins 50.0%.
C still has the worse deck. C is just good enough that it does not matter. That is the entire trick: do not hide the spending, price it, then find an opponent worth it.
I simulated all of this on the real 40,000-player pool, and one result made me stop and re-check my code.
| Policy | Do card levels still predict the winner? |
|---|---|
| Status quo, pair on trophies | 0.569 |
| Spend-blind, ignore purchases, pair on skill | 0.577 (worse) |
| Balanced, pair on predicted strength | 0.506 |
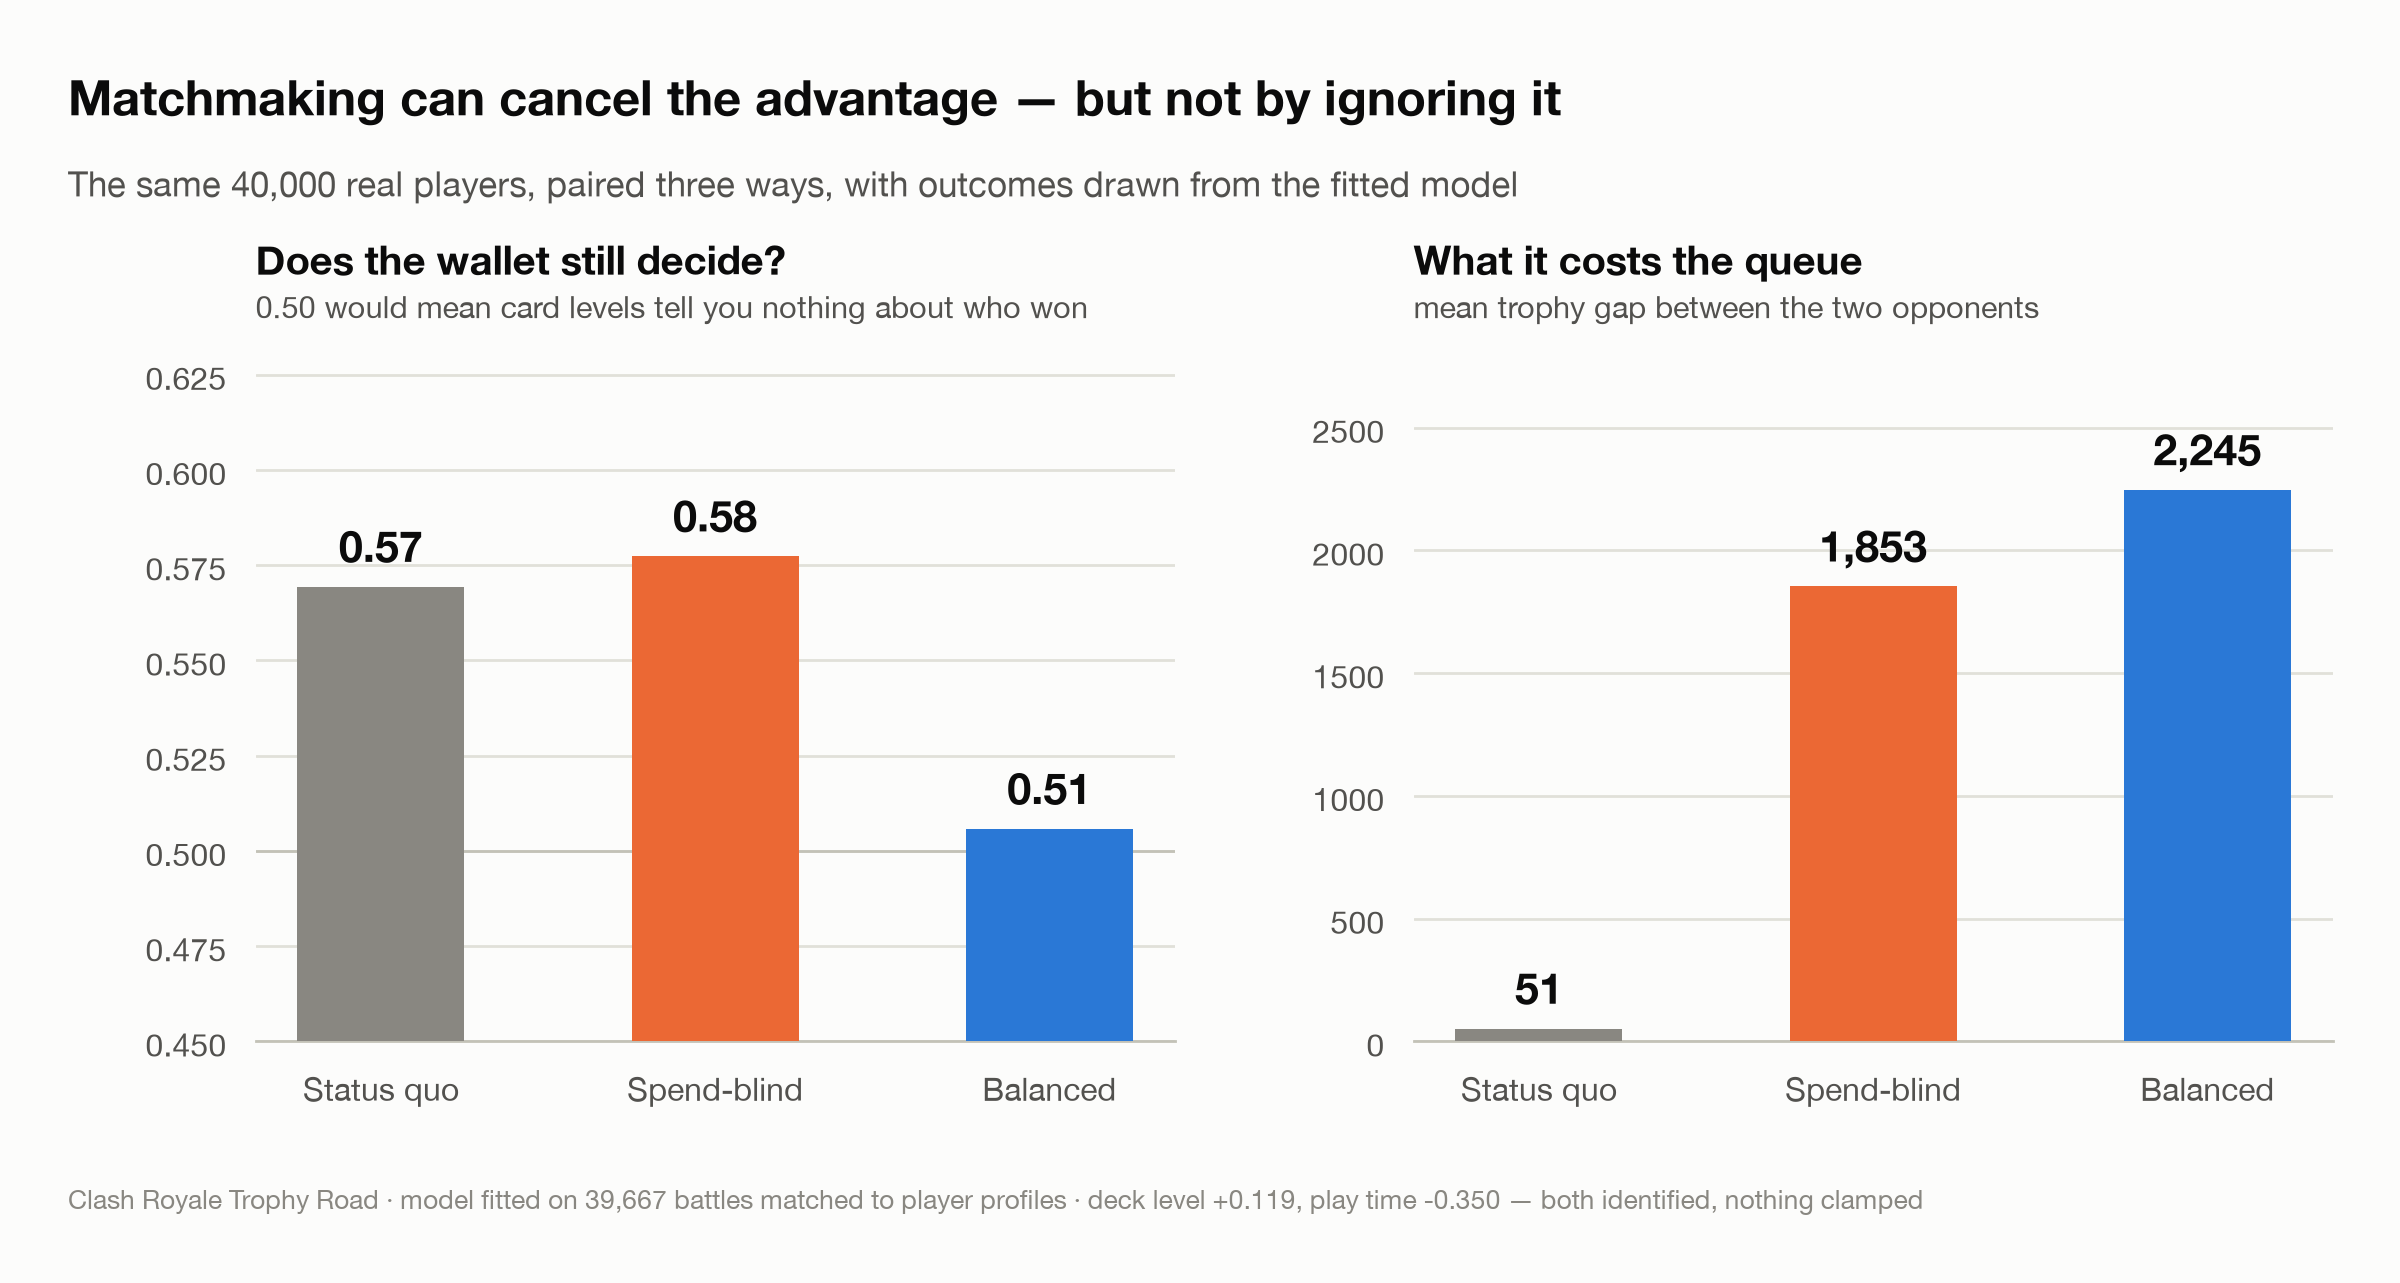
The intuitive fix, "make the matchmaker blind to what people bought", is worse than doing nothing.
I had to think about it for a while before it clicked. If you pair two players of equal skill and ignore their decks, then the deck is the only thing left that can decide the match. You have accidentally built the purest pay-to-win matchup possible. Fairness-through-blindness does not just fail here, it actively backfires.
The balanced policy also produces beautifully close games as a side effect. The average match goes from 0.105 away from a coin flip to 0.002.
There is a bill, and I would rather print it than bury it: opponents end up around 2,245 trophies apart. Trophies stop being a clean ladder. The answer is to split the two jobs that a single number is currently doing badly: rank players on a spend-blind rating, and match them on predicted strength. Your leaderboard and your matchmaker do not have to use the same score.
What I would say to someone who builds one of these
If you make a game with a shop, three things from this.
You are probably already measuring the wrong thing
Revenue per user tells you what people spent. It says nothing about whether spending is deciding matches. Those are different questions and only one of them predicts whether players stay. Measure the gap, how much better you can predict a winner once you know what they bought.
Fairness by blindness backfires
This is the finding I would want on a slide. Removing spending from the matchmaker's inputs makes the problem worse, not better. The same trap shows up anywhere people try to make a model "fair" by deleting the sensitive variable. You do not remove its influence, you just lose the ability to correct for it. Games are a very clean demonstration of a very general mistake.
And the ceiling is a design decision, not a modelling one
This is the honest limit of everything I did. A good matchmaker cancels the advantage in the pairing, it finds someone good enough to offset your wallet. It does not remove the advantage from the match. That level 14 card still hits harder once the whistle blows.
Removing it takes a design decision, and Clash Royale's capped queue is what that looks like when a studio actually makes one: 96.9% of the effect, gone.
So: machine learning can make the matchmaking fair. Only design can make the game fair. Anyone selling you the first as if it were the second is selling you something.
What this does not tell you
Being clear about the edges, because I would want to know:
Card level is not money. It is accumulated resources, and both time and money fill that bucket. That is why the play-time test matters, and why "68% survives" is an upper bound on spending rather than a measurement of it. Throughout, the honest phrase is spend-linked, not spend.
Dota's floor is my method's floor. Any spend-linked feature carries some information about how invested a player is. 0.10 is what that contamination looks like when the true effect is known to be zero. It is a correction, not a criticism of Dota.
The FC 26 outcome side is missing entirely, and no amount of cleverness fixes that from outside. If anyone at EA ever publishes match logs with squad ratings, the analysis is about forty lines of code away.
And the matchmaking result is a simulation. Real pairing, real players, real fitted coefficients, but simulated outcomes. It is a strong argument, not a shipped result. The queue comparison is the shipped result, and it is the one I would stake the article on.
I started this because I was annoyed. I had lost a game I felt like I should have won, and I wanted something better than a feeling to be annoyed about.
What I ended up with is more interesting than the complaint. The pay-to-win effect in Clash Royale is real and roughly six times the floor set by a game that provably has none. It is not just a proxy for playing a lot. It can be almost entirely cancelled by a matchmaker that takes spending seriously instead of pretending not to see it. And the studio in question already ships a queue that does exactly that. They simply also ship the other one.
None of which is a technology problem. Every part of this is solvable, and most of it is already solved somewhere in the same app.
Which leaves one question, and it is not for the engineers.
Code and data sources
- price-of-winning-game, the crawlers, models and matchmaking simulation behind every number in this article
- OpenDota API, 41,504 ranked Dota 2 matches with per-player cosmetic item counts
- Supercell Clash Royale API, 613,616 battles and 43,199 player profiles, July to August 2026
- EA FC 26 Ultimate Team card database, 2,226 current cards with live transfer-market prices